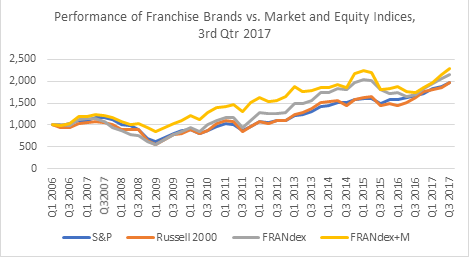
FRANdex outperformed both the S&P 500 and the Russell 2000 in Q3 2017, however its Q-o-Q growth lagged the Russell 2000 index. For the quarter, the S&P 500 was up 5.51%, and the Russell 2000 gained 6.57%. Returns for franchise companies increased by 5.53%. The non-food segment led gains with a 10.30% Q-o-Q return. Food […]

Lenders Counter with Technology Solutions The historically flat yield curve and rising internal costs are reducing small business lending profitability, pushing lenders into a classic capital for labor shift – relying more on technology to evaluate brands and borrowers. In a poll of more than 150 Lenders– 89% found that evaluating the franchise brand’s credit profile […]
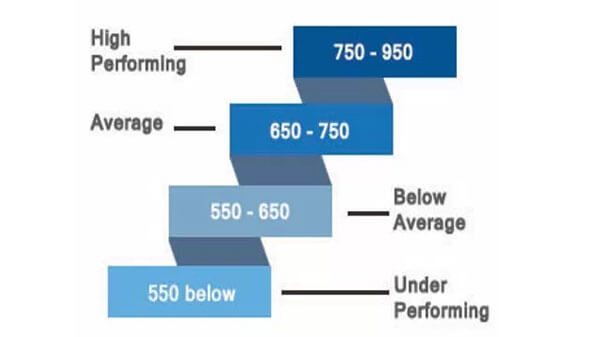
Possessing franchise information going back decades, FRANdata was in a unique position to assist the lending community to build an accurate credit risk assessment system for franchise brands. With lots of input from experienced franchise lending institutions, FRANdata developed a model that measures credit risk in franchise brands. Applying this model to more than 500 […]

On October 13, 2017 the SBA released a policy notice regarding their franchise SOP that takes effect January 1st 2018. FRANdata has long served as the franchising gateway to the SBA and we are pleased that they will be utilizing a similar structured approach to many of the franchise affiliation and business eligibility solutions in […]
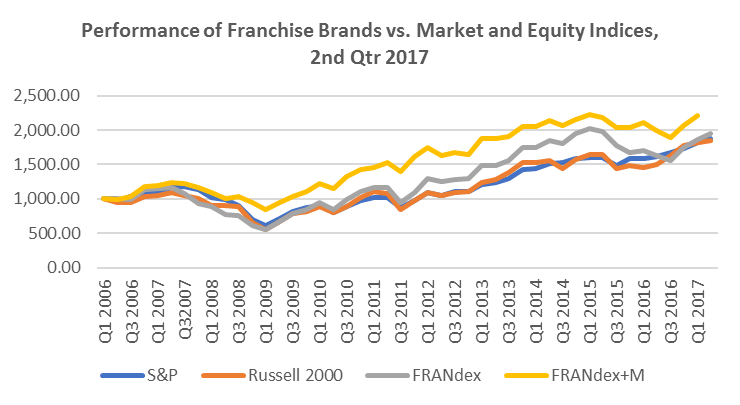
FRANdex continued to outperform both the S&P 500 and Russell 2000 in Q2 2017. For the quarter, the S&P 500 was up 2.57%, and the Russell 2000 gained 2.08%. Franchise companies increased by 6.42%. The food segment led gains with a 7.64% return and non-food brands registered a 5.64% return. Small-caps have struggled thus far […]