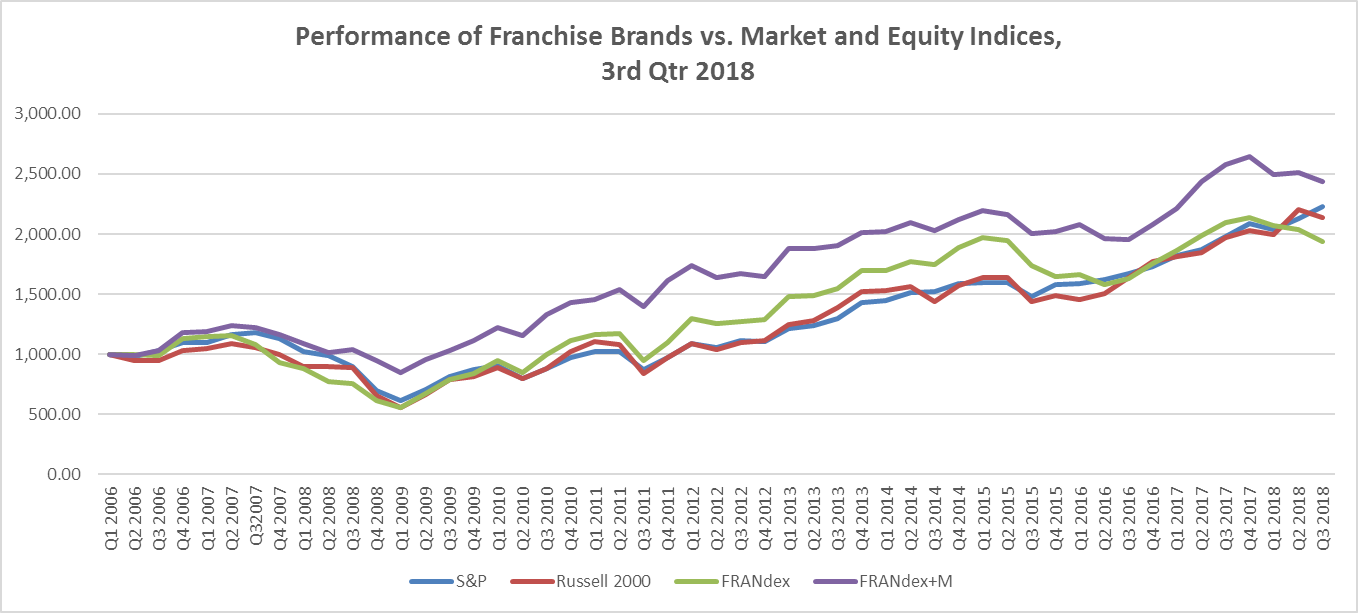
Just as the FRANdex had started showing signs of recovery in the previous quarter, the rise in take-private PE acquisitions created dents to the index performance in Q3-2018. FRANdex underperformed both the broad indices. While the S&P 500 rose by 4.8%, Russell 500 declined by 3.2%; in the same period FRANdex declined by 5.1% q-o-q. […]


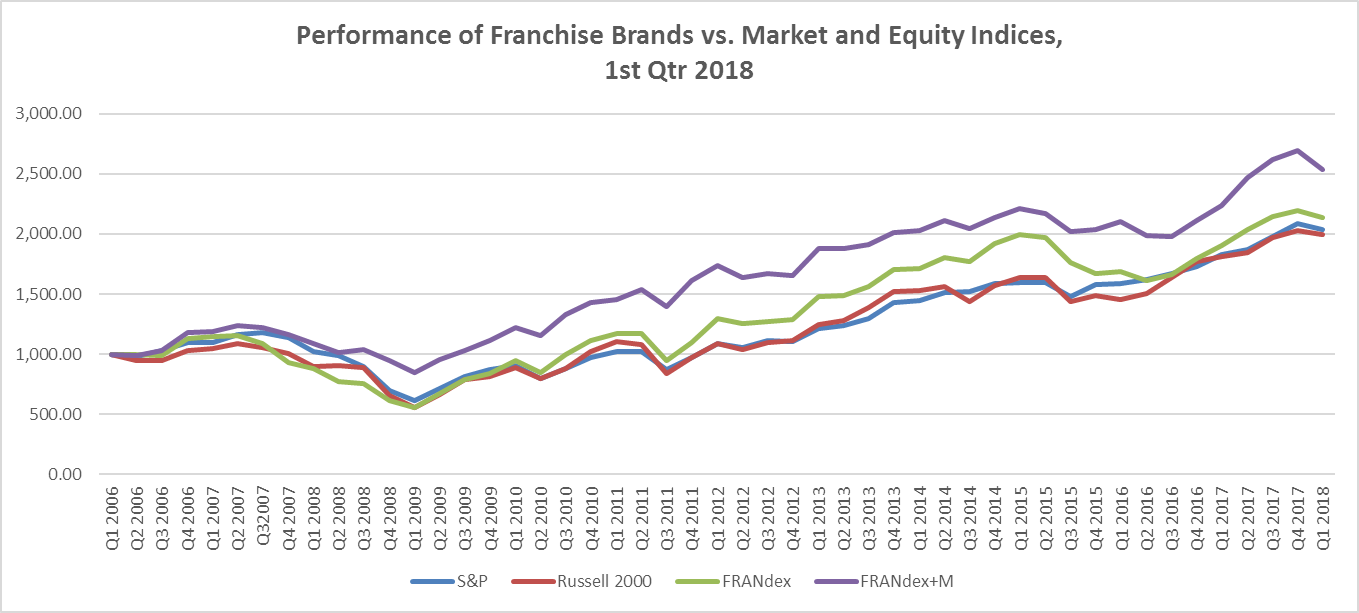
After a rough stretch of market volatility, the FRANdex just snapped its quarterly win streak that stretches back to 2016. FRANdex registered lower Q-o-Q returns (-2.99%) as compared to both the broader indices. S&P 500’s returns were down -1.64%, while Russell 2000’s by -2.43%. Click here to download the latest FRANdex.

FRANdata developed and uses the FRANdex to see how franchising is performing against other indexes like the Dow Jones. With the recent crash of the Dow, we take a look at the impact it’s had on franchising. The falling stock market crash had a significant impact on companies in the FRANdex: Its periodic decline […]

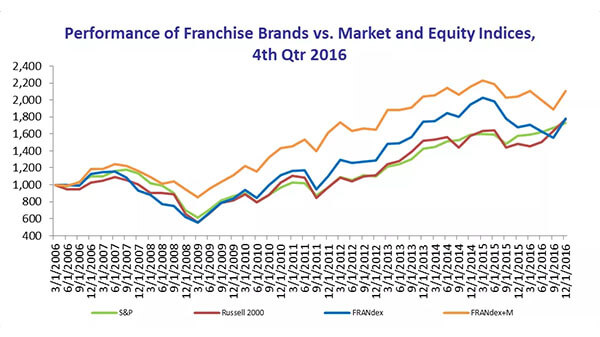
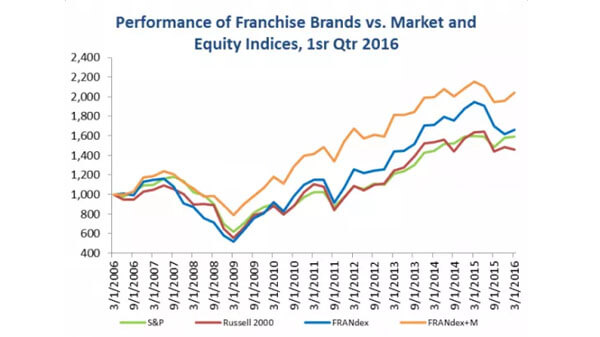
FRANdex tracks the performance, based on market capitalization, of 60 U.S.-based publicly-traded companies operating under and generating income through the franchise business model. Collectively, these companies operate 138 franchise brands. All index levels are normalized to 1,000 at Q1 2006 for comparison purposes, and all remaining periods are adjusted accordingly. As McDonald’s represents over 25% […]

The second quarter of 2016 was marked by uncertainty, as legislative rulings challenged the structure of the business model. Planet Fitness (PLNT) registered the highest gain at 38.1%, followed by Jack in the Box (JACK). Other top performers were Papa Johns (PZZA), Krispy Kreme Doughnuts (KKD), and Wingstop (WING); immediately after this reporting period, Krispy […]


